Let’s take a look at how we identify signs of stress on your hair tissue mineral analysis test. This post is first in a series of about how we can use functional lab testing to learn about your current vitality level. As a functional practitioner, one of my intentions is to support people in becoming more resilient. To identify and minimize the stressors that their system handles on an ongoing basis, and to support adaptability in handling new stressors as they arise. Hair tissue mineral analysis is a high value / low cost functional health test that we can monitor regularly to keep an eye on, among other things, how well your body is dealing with stress.

What do we mean by stress? Anything that compromises body function. This includes situational stresses like running late for a meeting, having a disagreement with a loved one, or being concerned about finances. It also includes exposure to environmental toxins or infections that impact our detoxification, immune, and circulatory systems, along with impacting cellular energy production.
Minerals in the body
Minerals, in addition to contributing to tissue structure and stability, are the “spark plugs” that ignite enzymatic reactions throughout the body. One of the main jobs of the digestive system is to break down and utilize nutrients that come from the food you eat. That’s where minerals come from. At the same time, minerals are required to do the job. They keep your teeth strong, support muscle contraction to chew your food, contribute to hydrochloric acid production to break the food down, and support transport of the resulting slurry through the intestines. Minerals are gatekeepers for the passage of nutrients into each cell. This sustains tissue oxygen levels, promotes cellular energy production, helps maintain balanced blood glucose, and so much more. Minerals in proper amounts are necessary for the maintenance of health.
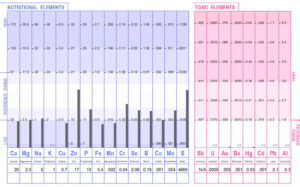
As we prepare to look at our first mineral graph together, let’s orient. The left-most section of the graphs (colored blue) represent this lab’s reporting of nutrient minerals. This test was processed by Trace Elements International Lab, which I work with frequently. The first four minerals listed, reading left to right, are “macro minerals.” They are present in greater quantity in our bodies as compared with the remaining micro nutrients.
The four macro minerals we’ll be looking at here are:
- Calcium (Ca)
- Magnesium (Mg)
- Sodium (Na)
- Potassium (K)
Mineral depletion
Sometimes, we’ll look at a mineral analysis test report and see that many of the major nutrient minerals report low. Long-term stress contributes to this. Under an acute stress reaction, the body utilizes minerals quickly. As a stress state becomes prolonged, resources dwindle. Unless the person continuously replenishes minerals with a nutrient-rich diet or supplementation, excessive utilization depletes the body’s mineral stores. Under these circumstances, we’ll see a depleted mineral pattern such as the one illustrated here. Notice that all four of the body’s most abundant minerals (left-most on this chart) represent well below optimal levels.

the effects of long-term stress.
Another reason for a consistently low mineral pattern is poor assimilation of nutrients. In other words, somewhere along the digestive chain, there is a loss of function. Perhaps food doesn’t get broken down well in the stomach, or it may not be absorbed well in the intestine.
Stress plays a role here, too. When someone perceives lack of safety, their body gears up to fight or flee (or freeze, which is a slightly different story). Stress hormones are unleashed, and the person’s autonomic nervous system prioritizes blood flow into the limbs (to run), lungs (to breathe), and basically any function that primes the person to leap into action to defend themselves. At the same time, circulation is diverted away from the digestive tract and other “non-essential” regions.
Physiologcal stress
Physiological stress also affects nutrient levels. For example, in someone with an intolerance to gluten, the tiny cilia (projections of tissue on the walls of the small intestine) degrade. These cilia normally make up much of the absorptive surface of the intestinal tract. When they aren’t functioning well, the person is unable to absorb the full nutrient value from the food they eat.
With long-term stress comes digestive dysfunction. When we see low mineral representation across the full panel, poor nutrient assimilation related to digestive distress is one of the first things on our radar.
One further physiological stressor that we can observe from this lab graph is the implied presence of toxic metals in the person’s body. Interpretation of a hair tissue mineral analysis test is not always straightforward. Notice that in the section on the right (pink), there are almost no toxic metals represented. We all have exposure to toxic metals. This person is not metabolizing and releasing them well. If toxins are not being moved out, then they’re stored in body tissue, where they influence, among other things, immune function. There are indicators of this in the nutrient mineral pattern as well. Sufficient nutrient minerals in proper balance are required in order for the body to remove toxins and metabolic waste efficiently.
Sodium, stress, and stimulants
Stimulant medications are frequently prescribed for people who experience focus issues. I am not a medication expert, however sometimes the people I work with are taking medications when they arrive. It’s useful to have a basic idea how certain medication types are intended to work. A stimulant “stimulates” the body to increase its production or utilization of the neurotransmitter dopamine (increases feelings of pleasure and satisfaction). It also increases norepinephrine, typically produced in the body during the initial stages of intense stress. It’s part of the body’s alarm reaction. Not all stimulants work in exactly the same way.

Here’s how the effects of norepinephrine can be described. If you’re familiar with what happens to the body during a fight or flight response, then this is going to sound familiar. “In the brain, norepinephrine increases arousal and alertness, promotes vigilance, enhances formation and retrieval of memory, and focuses attention; it also increases restlessness and anxiety. In the rest of the body, norepinephrine increases heart rate and blood pressure, triggers the release of glucose from energy stores, increases blood flow to skeletal muscle, reduces blood flow to the gastrointestinal system, and inhibits voiding of the bladder and gastrointestinal motility.”
We’re all stressed, aren’t we?
Here’s the situation. Most of us are under a fair amount of stress on a daily basis. Even kids, teens, and young adults. Stress increases the metabolic rate, which means that nutrients — including minerals and vitamins — are utilized at a faster rate. At the same time, appetite and gastrointestinal function are decreased. According to mineral expert, Dr. David Watts, “Prolonged stress can result in severe nutritional deficiencies” due to increased nutrient demand. It’s not unusual to hear that a child taking stimulant medications to improve focus is of small stature. The demand for nutrients may exceed availability, which slows the child’s growth.
Consecutive mineral analysis tests – starting a stimulant medication

commencing stimulant medication.
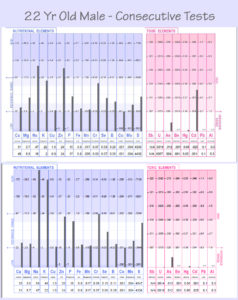
The signs of stress in these hair tissue mineral analysis test results are very interesting. Let’s look specifically at sodium (Na) and potassium (K). When high, these two minerals reflect an active high stress / fast metabolic pattern. Looking at the results on the left, our 22 year old male, the test graph on top shows sodium and potassium above optimal levels. This was his natural state at the time. His metabolism was already pretty fast, and he was burning through minerals quickly.
When the next mineral analysis test results (bottom graph) came in, his sodium was literally off the chart, and potassium wasn’t far behind. I called his mom and asked, “What happened?” Turns out he had started taking a stimulant a couple of months earlier (and they hadn’t mentioned it to me). Talk about stress! But this is what stimulants do in the body. They speed up metabolism, and with it, nutrient activity. The disparity we see here between stimulating sodium (Na) and calming magnesium (Mg) represents a concerning strain on the cardiovascular system. In a balanced state, they would both register as about equal on the chart.
Consecutive mineral analysis tests — going off stimulant medication

going off stimulant medication
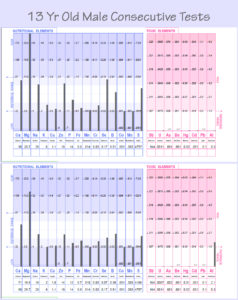
Now let’s look at the next set of consecutive mineral analysis test results — from a 13 year old male. In this case, he was already taking a prescribed stimulant when we ran the first test, whose results you see on the top graph. This is a slow metabolic pattern — in a young man whose system is being driven by a stimulant medication. The more sedating macro minerals, Calcium (Ca) and magnesium (Mg), are higher than stimulating sodium (Na) and potassium (K). Are you thinking what I am? Something doesn’t add up. This young man’s body was so short of vitalizing nutrients that even an amphetamine couldn’t raise his metabolic rate.
In this case, the young man, at his doctor’s suggestion, stopped taking the stimulant. When we completed the next test in this series (bottom graph), he had been off the amphetamine for a time, and we could see where his natural metabolism shook out. See how the bottom graph shows much lower sodium and potassium? Well below optimal levels. In fact, mineral excretion into his hair is low nearly across the board. So this young man, at age 13, was already showing some concerning nutrient deficiencies as a result of long-term stress. Each of these deficiencies represents limiting factors for healthy cellular function and energy production. We see that there can be far-reaching consequences of driving metabolism beyond the body’s capacity to compensate.
Different stages of stress
In conclusion, stress will initially increase mineral expenditure by the body, supporting a speeding-up of metabolism. This is sometimes referred to as an “alarm” stage of stress. Fight or flight. In terms of health consequences, keep an eye on the cardiovascular system. There may also be the beginning of digestive issues or mood issues where the person may be quick to snap or feel anxious.
But after a time, when the stress has continued unchecked, the “alarm” state is no longer possible to maintain. The body runs low on resources. And then we see nutrient levels start to drop. At the same time, metabolism — out of necessity — slows down. If you ask a person in this stage of stress about their energy level, they’ll tell you they feel fatigued. Maybe they have a really hard time getting up in the morning, or their energy drops in the afternoon. They may not sleep well. In terms of health consequences, this is where we start to see more chronic conditions — blood sugar issues, more complex digestive issues, ineffective immune function, bone health issues, pain syndromes, depressed mood, and so on.
So as it turns out, signs of stress on your hair tissue mineral test are pretty clear to see. This low cost / high value test provides an excellent way to keep an eye on someone’s state of nutritional health over time. It’s really valuable, because we can monitor for changes and then make adjustments to change the trajectory, often before anything too serious gets locked into place.
Ready to check your own mineral balance?
Hair tissue mineral analysis testing is a high-value option to see how your body is handling stress even BEFORE any thing major goes wrong! Once we get the lab information, I work together with you to develop a strategy to bring about more balance, creating a more resiliant you.
Check out this page for info on how we can work together. https://wellnessimages.com/functional-health-consultation/

References and recommended reading:
- Center for Substance Abuse Treatment. Treatment for Stimulant Use Disorders. Rockville (MD): Substance Abuse and Mental Health Services Administration (US); 1999. (Treatment Improvement Protocol (TIP) Series, No. 33.) Chapter 2—How Stimulants Affect the Brain and Behavior. Available from: https://www.ncbi.nlm.nih.gov/books/NBK64328/
- Dean, Carolyn, MD, ND. (2007) The Magnesium Miracle. New York: Ballantine Books.
- Drugs.com, reviewed 2018. Ritalin vs Adderall: What is the difference?
- Greenblatt, James, MD. (2017) Finally Focused. New York: Harmony Books.
- Samsel A, Seneff S. Glyphosate, pathways to modern diseases III: Manganese, neurological diseases, and associated pathologies. Surg Neurol Int. 2015;6:45. Published 2015 Mar 24. doi:10.4103/2152-7806.153876
- Samsel A, Seneff S. Glyphosate, pathways to modern diseases II: Celiac sprue and gluten intolerance. Interdiscip Toxicol. 2013;6(4):159‐184. doi:10.2478/intox-2013-0026
- Thompson, Robert, MD and Barnes, Kathleen (2013). The Calcium Lie II. Brevard, NC. Take Charge Books.
- Watts, David L. (1995). Trace Elements and Other Essential Nutrients. Addison, TX: Trace Elements.


